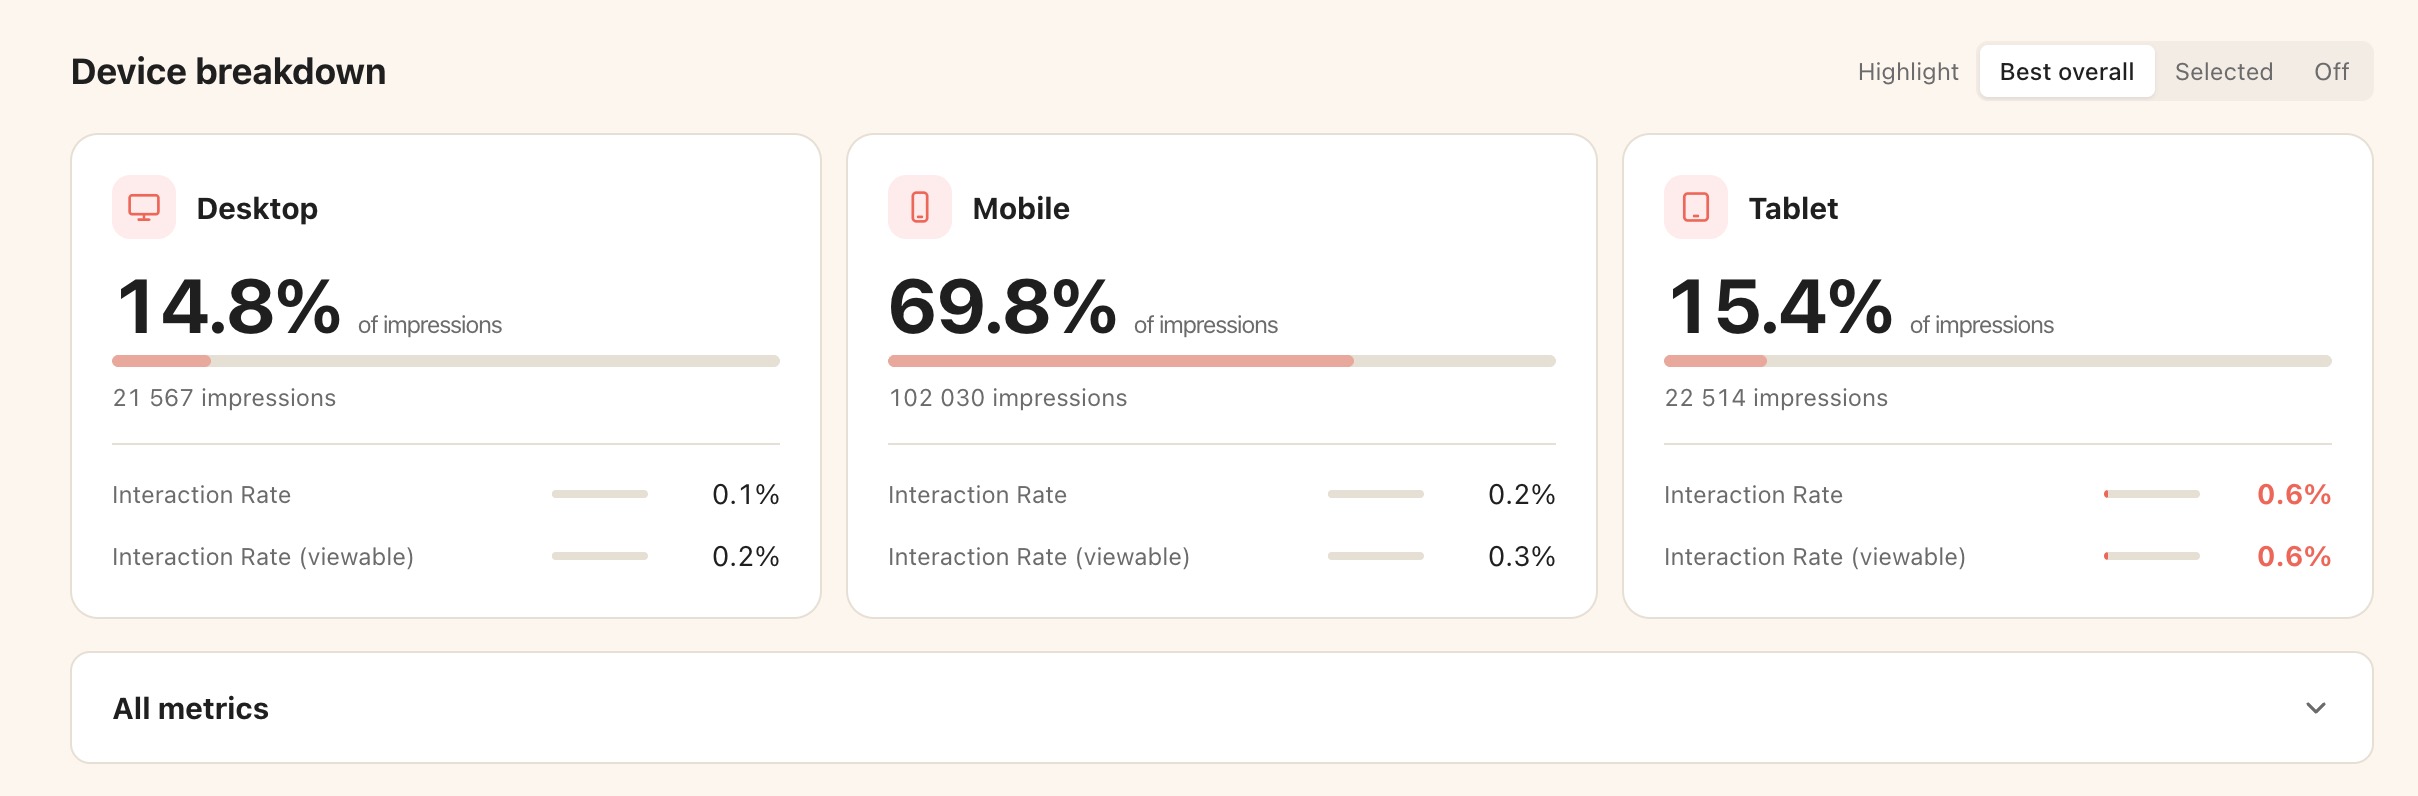
A new section shows how impressions are distributed across desktop, mobile, and tablet, with interaction rate comparisons for each device type.
Each device card displays its share of total impressions with a progress bar, plus key rates like Interaction Rate and Viewable Interaction Rate. A "Highlight best" toggle marks the top-performing device in red. An expandable "All metrics" table lets you dive deeper into any metric per device.
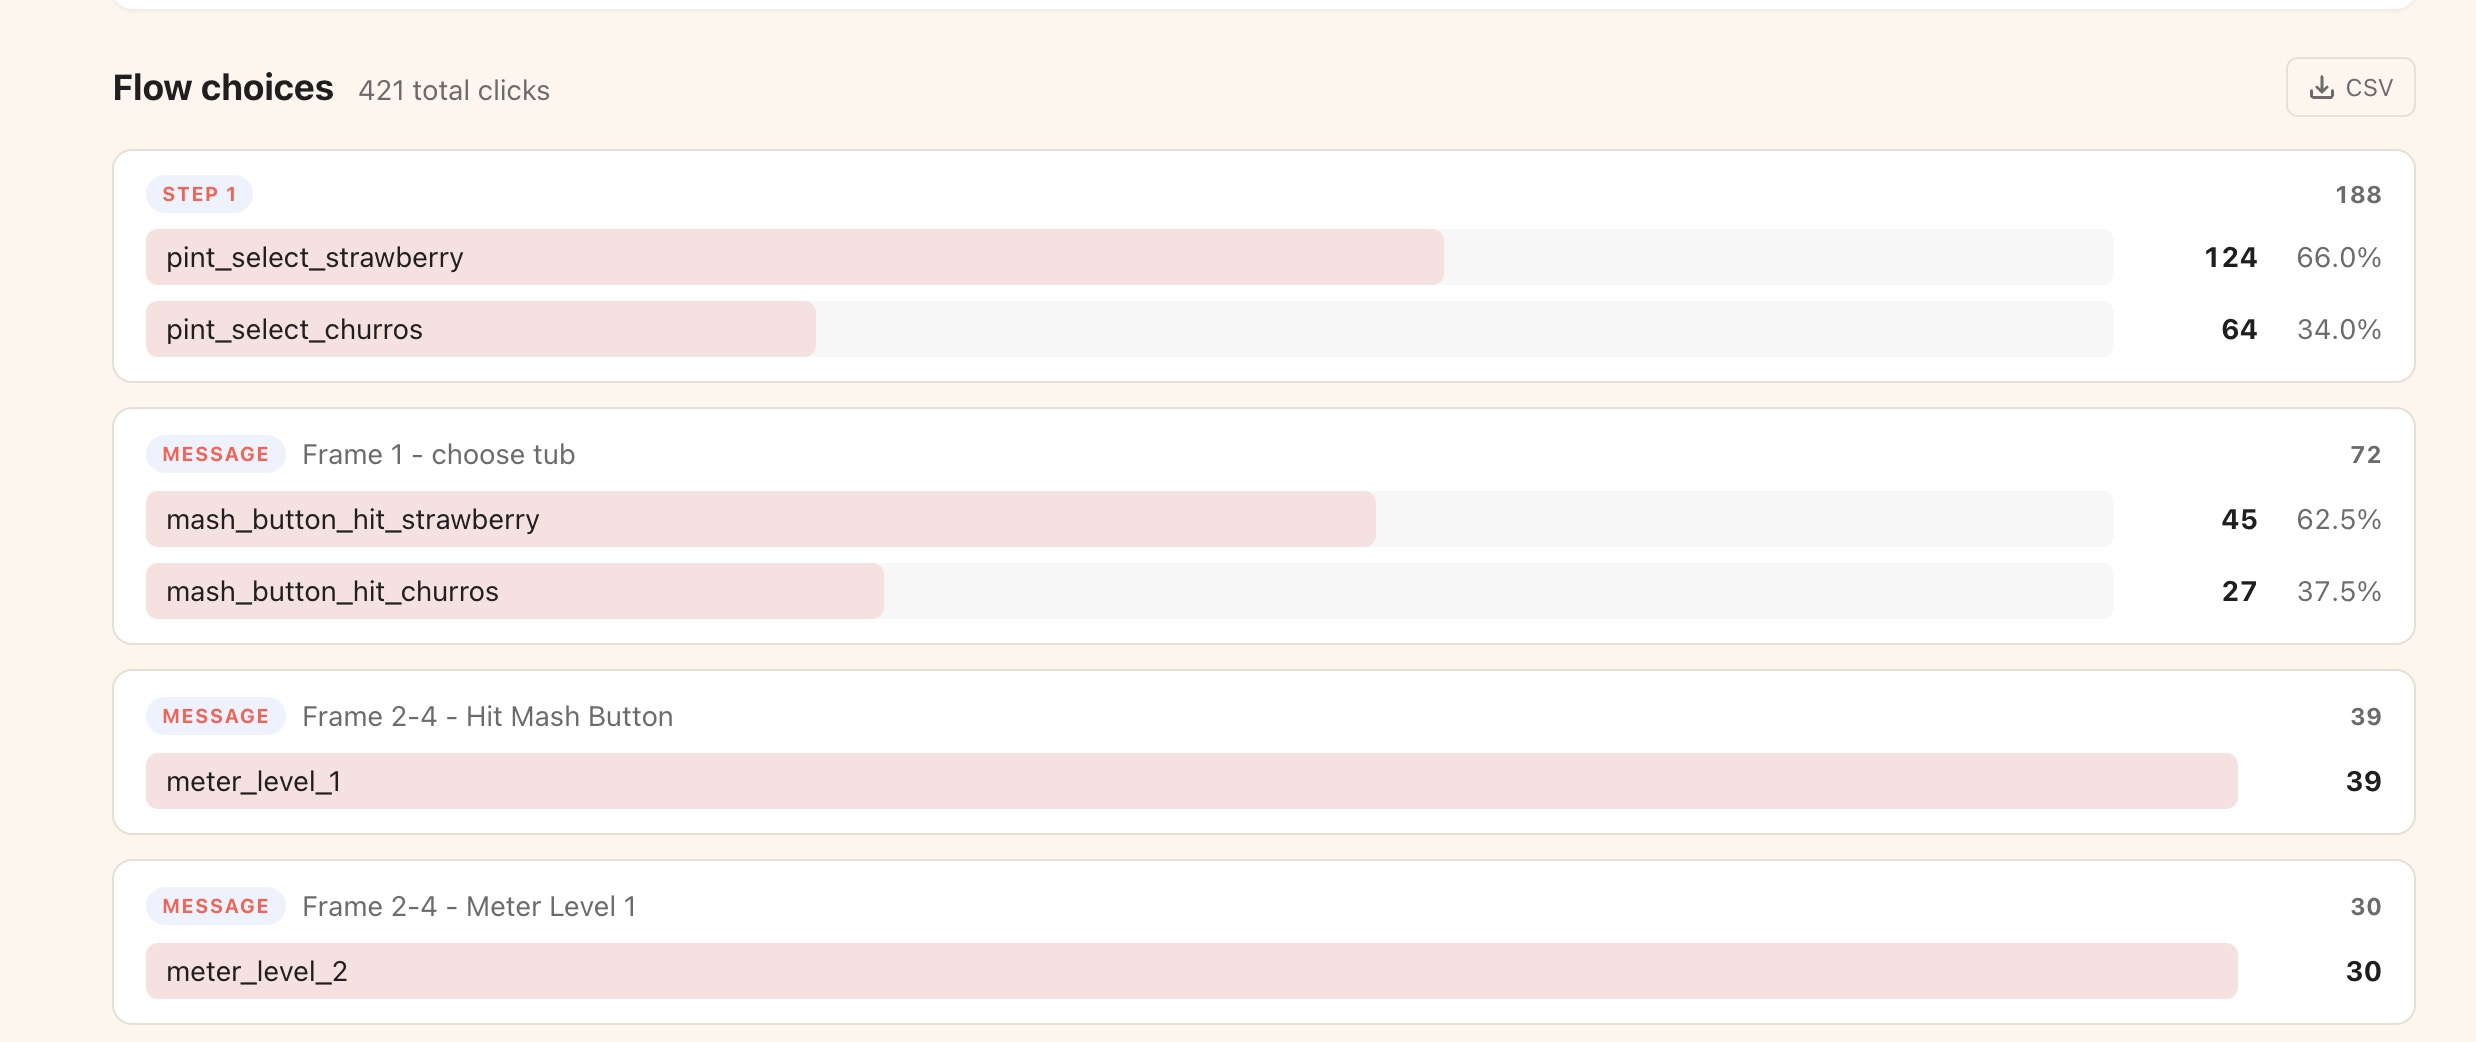
The flow choices section now has its own CSV download button, exporting each choice with share percentages and total flow percentages.
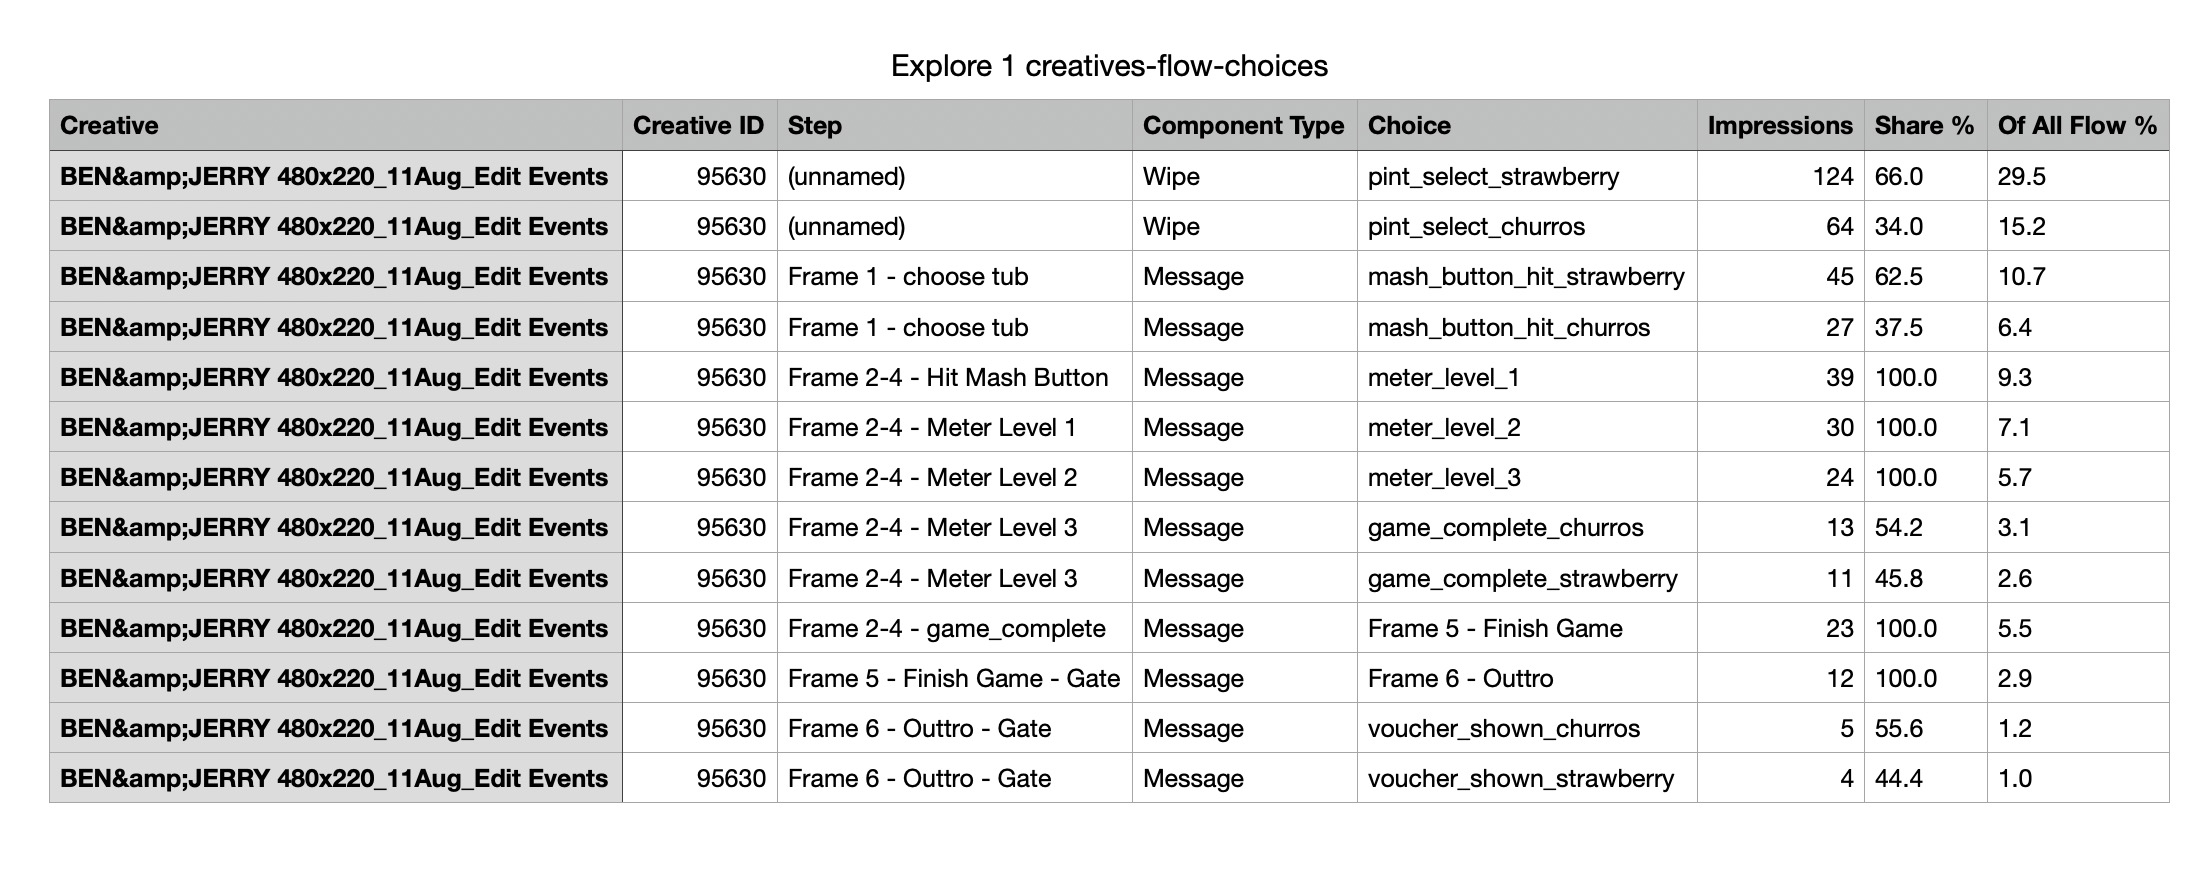
Choose which columns to include, pick a time granularity (hourly, daily, weekly, monthly), and export exactly the data you need. Your selections are remembered for next time.
The export buttons have been consolidated into a single dropdown menu in the toolbar. The export dialog lets you select fields, set a date range, and pick a time bucket before downloading.
Reports can now be scoped to a campaign, ad group, or individual creative, so you can focus on exactly the level of detail you need.
The resource picker supports campaign, group, and creative scope levels. Your selection is saved in the report URL, so sharing a link preserves the scope.
KPI cards with zero values are now hidden instead of shown as dimmed, keeping the dashboard focused on metrics that matter.
Corrected tooltip labels ("Chose" is now "Clicked"), fixed long title overflow, and the report creation form is now disabled after submit to prevent duplicate submissions.

